There are several reasons for this change:
a) bond market seasonality: as written in detail last week (see A look at bond market seasonality dated March 15), especially April historically provides strong headwinds for bond markets.
b) the weather pattern: Winter was severe in the US and large parts of the Eurozone with heavy snowstorms. A strong winter goes hand in hand with weaker retails sales, weaker housing sales and construction. Furthermore, severe winter storms had a temporarily significant impact on traffic. In turn, economic momentum for the December-February period should have been weaker than the underlying trend implies. However, the weather is not responsible for the underlying trend and as the weather normalises, economic momentum should improve again and temporarily be above the underlying trend (as parts of the loss in retails sales/housing market turnover should not be permanent but just have been delayed, i.e. there should be some pent-up demand which will be released once weather conditions have normalised again).
I previously showed a very profitable trading model based on the prevailing temperature for a given month vs. a multi-year average. The temperature is measured in so-called Heating Degree Days (and Cooling Degree Days for the summer months), a population weighted measure for the average temperature prevailing in the US. The model enters a receiving position in the USD 10y swap rate in a month following a colder-than-usual winter month (and warmer than usual summer month) and a paying position otherwise. For more details see for example Here Comes the Weatherman II).
However, there is also a good correlation between the HDD deviation from norm (with a positive number meaning that it is colder than usual and vice versa) and the Chicago Fed National Activity Indicator (the index is a weighted average of 85 indicators of economic activity and seen as a co-incident indicator) as the table below shows.
| | HDD deviation from norm | CFNAI |
| October | 49 | -0.90 |
| November | -97 | +0.14 |
| December | 50 | -0.50 |
| January | 14 | -0.04 |
| February | 78 | -0.64 |
November - which had unusually cold weather - saw a sharp rise in the CFNAI. However, the cold December and the cold February saw much lower levels of the CFNAI. January - with a close to average temperature - saw a temporary spike in the CFNAI.
However, if we look at weekly HDD data, the temperature prevailing in the US has turned warmer again earlier this month:
| Week Ending | HDD deviation from norm |
| 02. Jan 10 | 19 |
| 09. Jan 10 | 49 |
| 16. Jan 10 | 2 |
| 23. Jan 10 | -44 |
| 30. Jan 10 | -7 |
| 06. Feb 10 | 11 |
| 13. Feb 10 | 34 |
| 20. Feb 10 | 16 |
| 27. Feb 10 | 20 |
| 06. Mrz 10 | 15 |
| 13. Mrz 10 | -24 |
| 20. Mrz 10 | -28 |
c) the end of the Fed's mortage bond buying programme: The Fed will end its bond buying programme at the end of this month. The programme totalled USD 1.25trn and helped bringing mortgage rates lower. As this happened, other potential buyers of such product were looking for yield elsewhere and helped bring credit yields lower. Furthermore, the average duration of mortgage related securities (given that they have a prepayment option embedded) was reduced and likely fuelled a wave of convexity hedging (via receiving in swaps and to a lesser extent also buying of UST). This should have been a factor explaining the tightening in USD 10y swap spreads as the chart below tries to show (it shows the 10y USD swapspread and the Mortgage Bankers 15y fixed rate mortgage yield).
10y US Swapspread and 15y fixed rate mortgage show high correlation
However, as the massive buying ends while on the other side the supply of bonds will remain, it is likely that MBS yields will have to rise to find new buyers. With that the duration increases again and convexity hedging might move the other way, i.e. into a swap paying position. This should also take swap rates and swap spreads higher again and also exert a rising pressure on US Treasury yields.
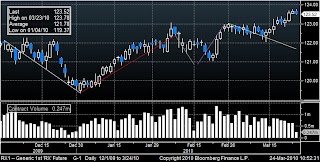
d) Technicals: On daily charts, the technical situation in 10y Bunds starts to look overbought. Furthermore, while the previous rallies were accompanied by rising volumes and the setbacks by falling volumes, the latest rally saw volumes declining further in both the 10y Bund future (see chart below) as well as the 10y TNote future. This suggests a changing trading behaviour and puts the latest rally on a weaker footing.
10y Bund future and volume: latest rally is not accompanied by rising volume anymore
Overall, this suggests that the current rally in bond prices is likely to end soon and should give way to a markedly negative trading environment with a likely significant rise in yields on an end-Q2 view. In light of this, I downgrade my strategic call from neutral to bearish (looking to re-enter longs around the end of Q2) and also change my tactical outlook from neutral with a bullish tilt to outright bearish. UST yields seem more at risk than their Eurozone core counterparts and I expect UST-Bund spreads to continue on their widening path.


No comments:
Post a Comment