a) This is my last post before going on vacation. I will resume blogging in mid August.
b) Swine Flu: at the beginning of last week, new Swine Flu infections have started to increase at a significantly faster rate in Germany. This is probably due to Germans returning from their summer vacations. As written in Deflation due to swine flu?, the swine flu might start to hit especially hard in September when most of the tourists are back from vacation and kids are back to school. Developments so far seem to underpin this scenario. Just to repeat: So far the mortatility rate has been low. Nevertheless, if indeed infections should affect roughly 25% of the population, it will have a significant impact on the economy. Both demand and supply will be negatively affected and therefore the impact on GDP growth is clearly negative.
On a different note, the Warwick Business School has developed an Influenza Pandemic Risk Index, which shows '...the UK most at risk to the spread of an influenza pandemic, ranking number 1 out of 213 countries. The Netherlands, Germany, Italy, Russia, Canada and Japan are also categorised as extreme risk because of their high population density, urbanisation and busy airports.' (for further details see here)
c) Markets: My assessment from last week (Market Update: Near-term risk-recovery not over yet) remains fully valid: it seems that the near-term risk-recovery can run further as Q3 growth is likely to surprise positively. However, growth in final demand promises to be much more subdued and risks moving lower again into autumn/winter. Therefore, the recovery remains a temporary one. While I previously expected the recovery across risky assets to be over by the end of this month, I now think it will likely extend well into August.
Monday, July 27, 2009
Thursday, July 23, 2009
Market Update: Near-term risk-recovery not over yet
The recovery in risky assets remains in full swing whereas the correction in government bonds is ongoing even though in comparison it is relatively shallow. While I have been expecting this risk-recovery period to be over by the end of this month (see for example Market Update: Temporary countermovement), there is a clear risk that it might last a few days longer. However, in line with my near-term growth outlook, I still expect this period to be a temporary one with a deeper correction in risky assets into autumn and winter.
Equity and credit markets continue to be the driver of risk recovery. Broadly speaking, credit spreads have tightened back to their early June lows while equities are back to their early June highs. However, regionally there are some significant differences. For example, the US Nasdaq and Dow Jones as well as the Swiss SMI, the Spanish IBEX or the Swedish OMX have all surpassed their early June highs on a significant basis. Others, for example the DJ Euro STOXX50 and the UK FTSE are almost exactly at the highs of early June while a third group such as the Nikkei or the Brazil Bovespa fall short of the early June levels. Commodities on the other side remain lagging and for example the CRB-index has only recovered approx. half the losses it incurred since mid June, trading some 7.5% below the June highs.
Technically, most markets do not seem overbought yet and also the fact that a growing number of equity indices is making new highs suggests that the upward movement can continue in the short term. This would fit with apparently still high cash levels for a large part of institutional and private investors as well as improving near-term growth prospects and the news so far regarding Q2 earnings. According to Bloomberg, 76% of the companies out of the S&P500 which have reported earnings surprised positively vs. consensus expectations. As Bloomberg states: 'Despite a 6.4% drop in earnings for companies that have announced their results, firms in aggregate have exceeded expectations by 16.1%. Financials has beaten analyst projections by the widest margin.'
Credit spreads back at early June tights...
 ...Equity markets back to approx. early June highs...
 ...wheras commodity markets lag in performance...
 ...while correction in government bonds is ongoing but relatively shallow

Finally, as these cost-cutting exercises are performed on an economy-wide basis, they risk threatening the recovery as they lead to further weakness in final demand with a time lag. This is becausse the cost-cutting exercise of one firm is being mirrored by other firms' revenues or households' incomes being cut, leading to weaker future demand.
Overall, it seems that the near-term risk-recovery can run further which means that bond prices will also correct lower. While I previously expected this period to be over by the end of this month, there is a clear risk that it might last a bit longer. However, the medium term outlook remains subdued and a renewed period where risky assets and government bond yields move lower - most likely for a prolonged period with more pronounced losses - is likely to start sometimes during August. Therefore, I reiterate once again that I maintain my strategic defensive asset allocation stance but stick to a reduced risk taking on a tactical basis. The 120 area in the Bund future still looks as a good target to open/add to long duration positions.
Equity and credit markets continue to be the driver of risk recovery. Broadly speaking, credit spreads have tightened back to their early June lows while equities are back to their early June highs. However, regionally there are some significant differences. For example, the US Nasdaq and Dow Jones as well as the Swiss SMI, the Spanish IBEX or the Swedish OMX have all surpassed their early June highs on a significant basis. Others, for example the DJ Euro STOXX50 and the UK FTSE are almost exactly at the highs of early June while a third group such as the Nikkei or the Brazil Bovespa fall short of the early June levels. Commodities on the other side remain lagging and for example the CRB-index has only recovered approx. half the losses it incurred since mid June, trading some 7.5% below the June highs.
Technically, most markets do not seem overbought yet and also the fact that a growing number of equity indices is making new highs suggests that the upward movement can continue in the short term. This would fit with apparently still high cash levels for a large part of institutional and private investors as well as improving near-term growth prospects and the news so far regarding Q2 earnings. According to Bloomberg, 76% of the companies out of the S&P500 which have reported earnings surprised positively vs. consensus expectations. As Bloomberg states: 'Despite a 6.4% drop in earnings for companies that have announced their results, firms in aggregate have exceeded expectations by 16.1%. Financials has beaten analyst projections by the widest margin.'
Credit spreads back at early June tights...
 ...Equity markets back to approx. early June highs...
 ...wheras commodity markets lag in performance...
 ...while correction in government bonds is ongoing but relatively shallow
Source: Bloomberg
However, despite the short-term risk recovery, my strategic asset allocation outlook remains cautious. As I laid down in Q3 growth likely to surprise positively but not final sales while near-term growth prospects look positive indeed, this is not the case for final demand and the growth rate should move lower again into autumn and winter, further aggravated by the rapidly rising risk of a swine flu pandemia in the Northern Hemisphere (see: Deflation due to swine flu?). Furthermore, I also see this subdued medium-term growth outlook being confirmed by the Q2 earnings season. To quote Bloomberg again: 'Revenue, excluding the Financials & Utilities sectors, is anticipated to be down 16.7% over the prior year. If the street consensus holds true, this will be the worst decline in the history of our database going back to 1994. Health Care is estimated to be the only sector to register an increase in sales.' If my impression is correct (sorry, but I could not find a hard statistic on this one), so far revenues vs. expectations has provided a mixed bag with several firms beating earnings expectations but falling short of revenue expectations. This to me suggests that more aggressive than anticipated cost-cutting exercises have been a key driver of earnings developments. It would also explain why the US unemployment rate has been increasing much faster than most anticipated even though Q1 (and most likely Q2) growth has not been much worse than expected. Furthermore, the divergence between earnings and revenue surprises explains as well the outperformance of credit and equity vs. commodities (i.e. still subdued growth in the demand for real assets).Finally, as these cost-cutting exercises are performed on an economy-wide basis, they risk threatening the recovery as they lead to further weakness in final demand with a time lag. This is becausse the cost-cutting exercise of one firm is being mirrored by other firms' revenues or households' incomes being cut, leading to weaker future demand.
Overall, it seems that the near-term risk-recovery can run further which means that bond prices will also correct lower. While I previously expected this period to be over by the end of this month, there is a clear risk that it might last a bit longer. However, the medium term outlook remains subdued and a renewed period where risky assets and government bond yields move lower - most likely for a prolonged period with more pronounced losses - is likely to start sometimes during August. Therefore, I reiterate once again that I maintain my strategic defensive asset allocation stance but stick to a reduced risk taking on a tactical basis. The 120 area in the Bund future still looks as a good target to open/add to long duration positions.
Wednesday, July 22, 2009
Random Thoughts July 22
A) Growth: Martin Feldstein thinks 'the economy could “flatten out” or “even be positive” in the third quarter, and then it’s likely to contract again in the last three months of the year as the effects of the federal stimulus program wear off and companies finish rebuilding inventories'. My own view about near-term growth prospects is similar (see here) as I think Q3 could even surprise positively in terms of GDP growth amid an end of the inventory correction, less negative contribution from residential investment, strenghtening effects from the fiscal stimulus and a less pronounced than usual seasonal drop in auto manufacturing. However, final demand should remain weak and with that GDP growth should move lower again into autumn/winter (further aggravated by the threat of the swine flu).
Regarding the longer term outlook, I argued frequently that nominal growth should stay low for an extended period of time amid weakness in consumption and investment as households and corporates restore their balance sheets resulting in limited inflation pressures. Richard Bernstein in an FT article - America is for now still blowing bubbles - comes to a similar conclusion but from a different angle (I totally agree with this view). He suggests that 'Financial history shows that bubbles create capacity, which is no longer needed once they deflate. An inevitable and intense period of consolidation follows....History would suggest, therefore, that there should now be massive overcapacity in the global economy. That is indeed the case. Global capacity utilisation was recently at generational lows. Ignoring this history, the goal of Washington’s policies has been to stymie the inevitable consolidation, keeping companies operating – and employing voters – rather than managing the consolidation to maximise the economic benefit. History says that Washington’s is an unwise and ultimately fruitless strategy. Certainly, there may be short-term gains in an economy by keeping a bubble’s unnecessary capacity alive (this may explain the recent improvement in economic statistics), but the continued misallocation of capital significantly hinders longer-term growth....Many observers claim that comparisons between the US and Japanese economies are inaccurate because the US economy is more “dynamic” and less “rigid”. There are, of course, differences between the two economies, but it seems increasingly clear that both the US public sector and, with CIT, now the private sector too are working against post-bubble consolidation, slowing the economy’s dynamism and increasing rigidity.'
In light of my expectations for growth and inflation, FOMC Chairman Bernanke's testimony stated rather the obvious: the Fed has several tools to withdraw the policy accommodation but they wont be used for an extended period of time...
b) Demographics: This UK Telegraph article (World's elderly to overtake number of infants) reports that each month the number of people aged 65+ grows by 870,000. The main conclusion of the article is that 'this will reduce the size of the working population and impose huge new pension costs, threatening to reduce the overall growth of the world economy.'
An ageing society is nothing new amid the drop in fertility rates and the rise in life expectancy especially during the past century and has not threatened economic prosperity, rather to the contrary. What is new is that now more people get older than 65 which is close to the statutory age of retirement in a host of countries. As I suggested in Demographics, the savings ratio and interest rates, that retirement age is not set in stone. It might be difficult to change the retirement age but the pressure to do so will increase in the years ahead given the rising expenses for social security and amid the huge fiscal deficits. George Magnus in this FT article (Older societies have to retire later) makes the same point.
Tuesday, July 21, 2009
Deflation due to swine flu?
The UK Telegraph ran a story on Monday Swine flue threatens deflation slump, Ernst & Yound ITEM Club report warns. To quote: "The group said a pandemic reaching 100,00 cases a day by August, and lasting six months, would lead to a 7.5pc fall in GDP this year. The lingering damage would cause a further fall of 1.2pc next year. 'With the western world still teetering on the brink of deflation it is not an exaggeration to say that a pandemic on this scale could tip it over the edge,'it said. The figures are based on projections made by Sir Liam Donaldson, the Government's chief medical officer. The report assumes that infections will ultimately reach 50pc, with a mortality rate of 0.4pc. Most of spread will occur before a vaccine is ready. 'Sir Liam is an expert on pandemics. We think his advice should be taken very seriously,' said the report. 'The main effect on the supply side will be that sick employees cannot go to work. On the demand side, spending on discretionary goods and services such as restaurants or tourism is likely to fall as people stay away from public places to avoid infection. Uncertainty about these developments is likely to make businesses further postpone investment projects,' it said."
It has been relatively calm in the Northern Hemisphere regarding the Swine Flu over the past months. However, in the Southern Hemisphere where it is currently winter, the virus has spread further. For the Northern Hemisphere, the situation will get worse when the usual flu season starts, i.e. around autumn.
As this article suggests (written in German by the Swiss daily NZZ), the swine flu might start to hit especially hard in September when most of the tourists are back from vacation and kids are back to school (as schools are a good reservoire for a virus). The expert quoted expects a vaccine to be ready during October. Effectively a vaccine will be produced by mid August but needs to be tested for effectiveness and security which will last into September. Thereafter national authorities will be informed and have to decide how to proceed. For Switzerland it is expected that between 1 and 2mln people will catch the swine flu (out of approx. 7.7mln).
So far the mortatility rate has been low. Nevertheless, if indeed infections reach such a high percentage of the population, it will have a significant impact on the economy. Both demand and supply will be negatively affected and therefore the impact on GDP growth is clearly negative. However, I have my doubts whether this will prove deflationary. First, it affects both supply and demand and it is not clear how the balance between the two will shift. Will we end up having more goods relative to demand than would otherwise be the case or is supply falling more than demand? Furthermore, at least part of the drop in demand will likely be temporary only and be reversed once the pandemic subsides (i.e. if I do not buy a car this week because I am sick, I am most likely still going to buy it once I recover).
Overall, there is a substantial risk that economic growth will be hit seriously during autumn and winter in the Northern Hemisphere amid a swine flu pandemic. The impact on inflation is less clear cut though. Moreover, following the Swine Flu scare earlier this year which did not leave an impact on the major economies, markets do not seem to price this risk adequately. It would clearly be a negative for risky assets as well as a positive for government bonds (due to lower growth and rising risk aversion). Within the government bonds universe, however, it is not clear whether inflation linkers or nominals will be the winner. The likely effect of a Swine Flue pandemic as well as its timing lend further support to my base case that the current recovery in risky assets will prove temporary.
Monday, July 20, 2009
Q3 growth likely to surprise positively but not final sales
The near-term outlook for growth is clearly improving and positive growth rates for Q3 and into Q4 can be expected. The key drivers of a return to positive growth rates should be the abating of the inventory correction, the reduction in negative growth contributions especially from residential construction as well as from auto manufacturing and increasing effects from the enacted fiscal stimulus. As Janet Yellen, president of the San Francisco Federal Reserve, stated earlier this year: "It takes less than many people think for real GDP growth rates to turn positive. Just the elimination of drags on growth can do it. For example, residential construction has been declining for several years, subtracting about 1 percentage point from real GDP growth. Even if this spending were only to stabilize at today’s very low levels—not a robust performance at all—a 1 percentage point subtraction from growth would convert into a zero, boosting overall growth by 1 percentage point. A decline in the pace of inventory liquidation is another factor that could contribute to a pickup in growth. Inventory liquidation over the last few months has been unusually severe, especially in motor vehicles—a typical recession pattern. All it would take is a reduction in the pace of liquidation—not outright inventory building—to raise the GDP growth rate." For example, investment in single family structures (the most important component of residential investment) has fallen from roughly 3.5% of GDP in 2006 to 0.8% of GDP in Q109, substracting approx. 1% of GDP per year (see chart). This is significantly below the average level of the past decades and clearly it can not substract much more from GDP growth.
 Source: calculatedriskblog.com
So, purely due to technical reasons, growth is likely to rebound. This already gets mirrored in the situation in the job market. The chart below shows the jobs lost and gained during the recession (i.e. in between Dec 2007 and June 2009) in %-terms. Motor vehicles and parts (i.e. the auto industry) lost one third of its jobs. Furthermore, as a lot of auto workers have been sent home, the usual seasonal drop in auto employment during the summer months is a lot less pronounced. As the Atlanta Fed puts it: "On an unadjusted basis, the initial claims data showed a fairly large increase last week—up 86,000 workers. But claims for unemployment compensation typically rise in early July as auto plants shut down to retool for the new model year. The jump in claims this July hasn't been as large as in years past since many of the auto plants were waylaid earlier in the year. So on a 'seasonally adjusted' basis, the data showed a drop in claims of 47,000 workers."
 Now, we know that GDP data is also seasonally adjusted. Therefore, if the auto firms let go less people than usual for the summer (as they fired them earlier), then they will not cut production as much as usual (because they cut production earlier). In turn, it is very likely that seasonaly adjusted GDP will be showing a positive growth contribution from the auto sector this quarter.
But be warned: the real picture about the underlying strength of the auto industry will only emerge towards autumn. At that time the seasonal adjustments assume that the layed-off workers for the summer break are being re-hired again. While this may also be true this year, I do not expect this seasonal pattern to be as pronounced as is usually the case.
Overall, Q3 GDP growth in the US (and likely elsewhere as there are the same phenomenons at work) promises to be positive and likely even significantly so due to the less pronounced seasonal drop in production during the summer months. This should underpin risky assets in the short term.
I have to admit that while I expect the current upward movement across risky assets to be a 1-2 weeks phenomenon with the potential for new highs in equity markets (see here), the risk has grown somehwat that this move will be more pronounced and last a little longer.
However, despite this short-term risk, the medium term outlook remains very subdued. Given the ongoing deleveraging by private households (i.e. rising savings ratio) as well as rising unemployment coupled with limited wage growth, end-user demand does not promise to stage a significant and sustained comeback. Therefore, growth in final sales should do significantly worse than GDP growth during H209. In turn, the recovery in risky assets remains a temporary one whereas the sell-off in government bonds as well will prove to be another opportunity to buy into.
 Source: calculatedriskblog.com
 Now, we know that GDP data is also seasonally adjusted. Therefore, if the auto firms let go less people than usual for the summer (as they fired them earlier), then they will not cut production as much as usual (because they cut production earlier). In turn, it is very likely that seasonaly adjusted GDP will be showing a positive growth contribution from the auto sector this quarter.
But be warned: the real picture about the underlying strength of the auto industry will only emerge towards autumn. At that time the seasonal adjustments assume that the layed-off workers for the summer break are being re-hired again. While this may also be true this year, I do not expect this seasonal pattern to be as pronounced as is usually the case.
Overall, Q3 GDP growth in the US (and likely elsewhere as there are the same phenomenons at work) promises to be positive and likely even significantly so due to the less pronounced seasonal drop in production during the summer months. This should underpin risky assets in the short term.
I have to admit that while I expect the current upward movement across risky assets to be a 1-2 weeks phenomenon with the potential for new highs in equity markets (see here), the risk has grown somehwat that this move will be more pronounced and last a little longer.
However, despite this short-term risk, the medium term outlook remains very subdued. Given the ongoing deleveraging by private households (i.e. rising savings ratio) as well as rising unemployment coupled with limited wage growth, end-user demand does not promise to stage a significant and sustained comeback. Therefore, growth in final sales should do significantly worse than GDP growth during H209. In turn, the recovery in risky assets remains a temporary one whereas the sell-off in government bonds as well will prove to be another opportunity to buy into.
Friday, July 17, 2009
Demographics, the savings ratio and interest rates
It has been frequently stated that as populations get older (which is certainly happening amid rising life expectancy and low fertility rates), the savings ratio would fall and in turn (as there are less savings to buy financial assets) interest rates would be rising. As a result, longer-dated government bond yields are too low and will rise significantly – even irrespective of inflation developments – over the next years. The rise in the US savings ratio this year would then be only down to the fiscal stimulus and revert again soon.


This is down to the so-called life-cycle hypothesis of saving. Generally it is assumed that people below 35 of age do not save much (essentially because they cant), the next age group (35-50) is seen as having a moderate savings ratio and the pre-retirement age group is thought to have the highest savings ratio as they prepare for retirement. During retirement (i.e. roughly 64+ years), the savings ratio is seen to become negative as income drops. In turn, the savings rate in an economy should be the larger, the higher the ratio of people aged 35-64 relative to those >64 and <35 st="on">
The development of the Japanese savings ratio which fell significantly during the 1990s is taken as prove for this theory as Japan has the largest share of old-age inhabitants.
I have several reservations about this kind of analysis:
1. if that kind of analysis were to be true, why should only interest rates rise (i.e. demand for bonds fall)? Essentially, in such an environment the demand for any financial/real asset should fall and take its expected return higher. So, if anything it would be an argument against any asset.
2. Age structure is not the only determinant of an economy’s savings ratio. For example, this paper The Japanese Savings Rate between 1960-2000 suggests that the development of total factor productivity (TPF) is far more important than any other variable. If TFP falls, then the savings ratio falls (and vice versa). To me this makes a lot of sense. A higher TFP means that there are more profitable investment projects around. In turn, companies will increase their investments and in order to do so increase demand for saving funds via higher interest rates. As a result, households can achieve higher returns by saving than in a low TFP environment and c.p. should save more. However, while a falling savings ratio amid an older population would see yields rise, a fall in TFP depresses the savings ratio and lowers interest rates.
3. The provision of social security and the retirement age are also important factors. One reason why for example, Germany’s savings rate did not fall earlier this decade can be seen in the changes to social security where amongst others, the retirement age is slowly rising while the formula used to calculate pension entitlements has become less favorable. A higher retirement age means that a) employees will stay longer in the high-savings-ratio state and less generous state pensions means that private pensions become more important. Given that the state of public budgets is very challenging almost across the globe we should expect that more countries will increase (or at least try to increase) retirement age over the longer term.
4. As I stated already in Collapse in Private Pension Funds’ Assets a key reason for a secular rise in the savings ratio?, the people near retirement are those hit the hardest by the financial crisis. We should expect that especially people near retirement (and parts of the retirees) which have relied on private financial sources for their retirement are forced to save more. This can happen either via spending less or via working more (and retiring later).
Overall, I am not convinced that the US savings ratio is headed lower and with that interest rates higher over the next years already due to the baby-boomer generation entering retirment. First, their asset base has been hit hard and more baby-boomers will be forced to work longer and delay retirement. Second, the fiscal deficit situation suggests that over the longer term, retirement ages will have to be increased in a growing number of countries. Third, the development of total factor productivity seems to be a more important factor driving the savings ratio but with opposite effects on bond yields.
Thursday, July 16, 2009
Market Update: Impressed but not shocked
The correction in Bond markets as well as the recovery in risky assets is now well underway. Technicals have all turned relative to June's development as the upward trends in government bond futures have been broken to the downside and the downward trends in equity markets to the upside. Favorable Q2 earnings reports, the ongoing stabilisation in economic growth as well as firming expectations for positive growth during Q3 in the US provide the fundamental backdrop. I do not propose to stand in the way of this train. I maintain the view that 120 should provide a good support area - and entry area for potential longs - in the Bund future during this correction period which is likely to last another 1-2 weeks.
I have been looking for a consolidation in government bond prices since last week (see here) and also suggested that risky assets might recover again (see here) and the development in govies is so far playing out as expected. Also the recovery in commodity prices is in line with my expectations. As the chart shows, the CRB-Index has only moved moderately higher during the past days.
 Source: Bloomberg
However, the speed of the equity market recovery has been impressive. The chart below shows the Euro Stoxx 50 index (but the same applies to a lot of the major equity indeces). The downward trend line which guided market movements during the past weeks has been broken to the upside on a closing basis. Furthermore, during a period of only four days, two-thirds of the previous downmove has been corrected again. The positive fundamental news (mostly from the US earnings season) has met with a market that was positioned for a break lower. For one, investors' cash levels still appear high. Furthermore, there has been a lot of talk about a bearish so-called Head & Shoulders chart pattern developing for example in the S&P which seems to have led some technical oriented accounts to set up shorts (see here: Head&Shoulder failure).
 Source: Bloomberg
Clearly I see no reason to change my fundamental longer term macro-economic outlook where I expect muted growth and subdued inflation for the global economy and especially the large 'developed' countries (amid an ongoing deleveraging in the corporate and household sectors which will lead to weak demand growth). Essentially, growth on a quarter-over-quarter basis should oscillate around a low but slightly positive level (i.e. below trend) for the next several years. However, the ongoing economic stabilisation in the near term (amid a stop in the inventory correction and increasing effects of the enacted fiscal stimulus) is likely to fuel renewed hopes about a sustainable recovery and combined with still high levels of cash suggests that the current upward movement in equity markets risks surpassing the early June highs.
Therefore, I reiterate that I maintain my defensive asset allocation stance from a more medium-term strategic perspective but would reduce risk temporarily on all fronts.
I have been looking for a consolidation in government bond prices since last week (see here) and also suggested that risky assets might recover again (see here) and the development in govies is so far playing out as expected. Also the recovery in commodity prices is in line with my expectations. As the chart shows, the CRB-Index has only moved moderately higher during the past days.
 Source: Bloomberg
 Source: Bloomberg
Therefore, I reiterate that I maintain my defensive asset allocation stance from a more medium-term strategic perspective but would reduce risk temporarily on all fronts.
Tuesday, July 14, 2009
Market Update: Temporary Counter-movement
Since I changed the tactical Bund market outlook to neutral last week and advised UST-Bund spread tighteners, i.e. long UST positions vs. Bunds (see: Rates Strategy - digging below the surface), the Bund bull market has started to stall and Bunds have underperformed significantly vs. USTs. Still, up to yesterday afternoon, the Bund future has moved in a tight trading range and speaking of a consolidation would have been exaggerated. However, since then a more pronounced setback seems to have started and this morning the Bund future dropped below its upward trendline which has directed trading over the past month (see chart). 
Source: tradesignalonline.com
In combination with the current overbought stance this might indeed signal that the consolidation I am expecting to develop over the next 1-2 weeks has started. Furthermore, risky assets have been showing the opposite behaviour and I think especially the S&P500 is showing an interesting development. Over the past month, the S&P has lost almost 10% from its high (956 down to 869). On a closing basis, the support zone at 879 has held this week (even though on an intraday basis it was broken by approx. 1%). There has been a temporary recovery in late January which stalled at 878 and one in early February which stalled at 875. Furthermore, after the S&P broke through the 879 former resistance (after one failed attempt in April), this area served as a support and was tested several times in mid to late May. Therefore, from a technical perspective it is a strong signal that we could not move below 879 on a closing basis over the past days.

Source: tradesignalonline.com
In terms of newsflow, the start of US banks' earnings announcement is likely to provide some positive news (as was a key driver of yesterday's stock market gains). The former investment banks should have been able to profit from a recovery in risky assets during Q2 as well as high corporate bond issuance. As financial markets are ahead of the cycle, writedowns on risky assets tend to be ahead of the cycle as well. On the other side, loan losses tend to be more conincident but this affects more traditional banks than former investment banks.Overall, the tactical outlook for government bonds has worsened whereas it has improved for risky assets. I maintain my defensive asset allocation stance from a more medium-term strategic perspective (see here: Asset allocation defensive stance) but would reduce risk temporarily on all fronts trying to get back in at cheaper levels. I expect the setback in government bonds to be relatively moderate and would look for the Bund future to trade down towards the 120 area. Tactically, I recommend a neutral stance for UST and Bunds. For investors wanting to get long duration in government bonds, the next 1-2 weeks are likely to offer the first opportunity to do so since the recent bull market started in early June.
Monday, July 13, 2009
Switzerland 2 - 0 UK
Last week I wrote about the UK (see: The UK: down and out?) arguing that even though UK's green shoots have been greener than elsewhere I remain worried about the medium term prospects: In short, I do not see how the UK can get back on a sustainable growth path already and think that the positive economic surprises are purely down to a more pronounced macro-economic stimulus (especially via a weaker GBP) and will prove temporary. Rather, the structural problems are very pronounced and will take a long time to be reduced with trend growth falling significantly in turn. In combination with the huge fiscal and current account deficits, the risk remains that foreign investors will take money out of the UK again.
On the other side, I am less worried about the medium term prospects of Switzerland despite the current severe recession with the SNB expecting growth this year around -3%. Yes, similar to Germany and Japan, Switzerland is one of those countries with limited domestic imbalances but a significant dependence on exports. In fact, Switzerland is even more dependent on foreign demand than Japan or Germany as exports account for almost 50% of GDP (with the current account deficit in 2008 close to 10%) and according to the latest data for May, exports are down 21% from a year ago. Clearly, there is much more downside ahead for exports given that 60% of Switzerland's exports go to the EU with Europe's fall in demand only finding its way into Switzerland with a delay. Furthermore, with UBS, the largest bank continues to struggle. Finally, the cracks in the banking secrecy for non-residents are becoming larger and might threaten the status of Switzerland as an offshore financial centre.
However, there are several positives. First, while house prices rose steadily during the current decade, there was no real boom and the housing market does not appear significantly overvalued. Consumers as well do not appear overly stretched (as the overindebted, undersaving and overconsuming US and UK consumers). With respect to the state of the banking sector, UBS appears to be rather the exception than the rule and for example the state-near cantonal banks (in contrary to the German Landesbanks) have not been hurt significantly. More importantly, I think that besides the current cyclical weakness, the structural story for Switzerland as a refuge for rich individuals and international corporations has become even better. Yes, the bank secrecy is becoming a bit weaker for non-residents. But this is not the case for residents. Furthermore, the Swiss tax system remains extremely competitive internationally and given that taxes are rising (as in the UK) or likely to rise (as in the US) for the high-income earners, stable and low taxes in Switzerland are becoming even more competitive. The combination of higher taxes and higher tax-evasion hurdles for non-residents renders moving to Switzerland more attractive. For corporations a similar logic applies (with some hedge funds moving to Swizterland amid a threat of tougher EU-wide regulation) and just today McDonalds announced to be moving its European headquarters to Geneva from London amid more preferntial intellectual property tax laws (see here: Swiss tax rules lure McDonalds from UK).
This erodes the tax base of the affected countries but increases the tax base of Switzerland, helping to keep fiscal deficits in check without having to resort to tax increases, a positive feedback loop for Switzerland. Furthermore, the movement of people and corporate headquarters is increasing demand for the already scare land and houses, supporting their prices. Overall, therefore, I think that despite the significant cyclical weakness of the export-dependent Swiss economy, the medium term outlook is superior compared to the rest of Western Europe. Especially, scarce land/houses should do well over the medium term amid an increase in demand for high-priced office space and high-end housing. Domestically focused high-end corporates should see rising demand for their services. Additionally, the SNB will continue to struggle to fight the inherent strength of the CHF. Selling GBP vs. CHF looks attractive on a longer term horizon. However, export-dependent companies will continue to face a mix of weaker demand and an increasingly uncompetitive exchange rate.
Friday, July 10, 2009
Not again: inflation - or the lack of it
As I stated frequently, I do not see that too high inflation will become a problem over the next years for most of the so-called 'developed' economies (see for example here: Is Inflation just around the corner? Part II).
Clearly, the debate about the inflation outlook remains intense with the difference in views as wide as ever. The "Big Picture" blog has just published a lengthy guest article laying down the foundations of the inflationary view (see here). I will first provide a brief summary and then comment on that view.
In short the authors "believe macroeconomic fundamentals imply longer-term US Treasury yields should be priced above 10%". The reason is that they expect inflation to rise to 10% for several years. They state: "money growth is inflation and generally rising prices are frequently derivative of that money growth...The Fed just doubled the monetary base over the past nine months...So, in monetary terms, we've witnessed a massive dose of inflation. The growth in the US monetary base is the permanent addition of money to the system."
 Source: St. Louis Fed
This money the Fed created (via their asset purchases programes and lending facilities) went to the banking system in the form of reserves: "...money that everyone hopes the banking system will lend out to businesses, homeowners, consumers and investors at multiples of the Fed's mandated reserve requirements....and we can expect about USD8trillion in new credit chasing goods, services and assets. This new credit must help grow the economy in nominal terms because it will increase the nominal output of goods and services.....If we were somehow to attempt to annualize this paradigm shift, we would arrive at expected annual inflation that would easily exceed 10% for many years."
I have several problems with this reasoning. First, I do not regard a rise in the monetary base as being the same thing as inflation. Certainly, it can cause inflation (which I understand as an ongoing rise in the general price level) but there is not necessarily a 1:1 link. As I stated previously M*V=Y*P (i.e. the money times velocity of money equals output times price level) always holds because it is an identity. But that does not tell much. Unfortunately, there are various different forms of money (from 'high-powered' central bank money to broad credit aggregates) and additionally V is not a constant.
If the broad credit aggregates fall by more than narrow money aggregates rise, then V for narrow money aggregates is likely to fall (and it has been falling sharply over the past year). Additionally, just because the central bank creates more central-bank money, that does not mean that this will be hitting the economy. The authors themselves show this chart of banking reserves:
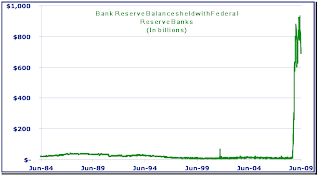 Source: Federal Reserve
That is exactly where the additional central bank money went to (the sizes are almost identical). Banks hold the additional central bank money in the form of excess reserves, meaning that the credit creation process is not working and the additional money is not being used to chase goods and services. Only once the banks are able and willing to extend credit again (i.e. the credit crunch is over as the financial sector has brought its balance sheet in order again) and additionally corporates and households want to borrow again (as they have cleaned up their balance sheets) can these additional reserves help to increase broad credit aggregates. Furthermore, the authors state that the rise in the monetary base is a permanent increase and that the Fed will not drain this money. However, I do not see a convincing reason why they would not reduce - at least partially - their lending and asset purchase programs further down the road if the economic outlook brightens significantly and thereby reduce the monetary base (in fact, the 1930s US and the 1990s Japan history suggests that there has to be a considerable risk that this stimulus is bgeing reduced too early). Furthermore, as the chart the authors provide themselves shows, the US monetary base has been shrinking again over the past months (in line with the shrinking of the US Fed's balance sheet). Therefore, the jury is out on whether and how much of the increase in the monetary base will prove permanent.
As an aside, this article entitled 'When is rapid growth in a central bank's balance sheet not cause for concern?' makes an interesting point about bank reserve developments in New Zealand. In July 2006, the Reserve Bank of New Zealand (RBNZ) changed the monetary policy operating system from a channel or corridor system to a floor system. "Under this floor system, the RBNZ stopped offering free collateralized daylight credit to banks for settlement purposes. In other words, they removed the distinction between daylight and overnight reserves. Also under this new system, reserves were remunerated at the official cash rate (OCR), the RBNZ's target interest rate." The new level of bank reserves increased by about 400times and moved to roughly NZD 8 billion (which corresponds to almost 25% of GDP). However, M1 was unmoved by this.
As the US Fed has started to pay for excess reserves, it should be expected that at least part of the rise in bank reserves is permanent and even once the ability of banks to extend credit is normalised and the demand for credit by corporates and households is rising as well, not all reserves will be used up.
So, in short broad based credit aggregates are falling by more than narrow-based monetary aggregates are rising. However, once broad-based credit aggregates are rising again (which can take a long time as it needs both, banks which are willing to lend and households/corporates which are willing to borrow), we should also expect narrow-based monetary aggregates to fall again. The ultimate inflationary pressure will be very limited and take a long time before it becomes evident.
For the time being, we still have too little money chasing too many goods resulting in disinflation or as in the case of Ireland in significantly negative inflation (or does anyone dare to say: deflation?):


Clearly, the debate about the inflation outlook remains intense with the difference in views as wide as ever. The "Big Picture" blog has just published a lengthy guest article laying down the foundations of the inflationary view (see here). I will first provide a brief summary and then comment on that view.
In short the authors "believe macroeconomic fundamentals imply longer-term US Treasury yields should be priced above 10%". The reason is that they expect inflation to rise to 10% for several years. They state: "money growth is inflation and generally rising prices are frequently derivative of that money growth...The Fed just doubled the monetary base over the past nine months...So, in monetary terms, we've witnessed a massive dose of inflation. The growth in the US monetary base is the permanent addition of money to the system."
 Source: St. Louis Fed
I have several problems with this reasoning. First, I do not regard a rise in the monetary base as being the same thing as inflation. Certainly, it can cause inflation (which I understand as an ongoing rise in the general price level) but there is not necessarily a 1:1 link. As I stated previously M*V=Y*P (i.e. the money times velocity of money equals output times price level) always holds because it is an identity. But that does not tell much. Unfortunately, there are various different forms of money (from 'high-powered' central bank money to broad credit aggregates) and additionally V is not a constant.
If the broad credit aggregates fall by more than narrow money aggregates rise, then V for narrow money aggregates is likely to fall (and it has been falling sharply over the past year). Additionally, just because the central bank creates more central-bank money, that does not mean that this will be hitting the economy. The authors themselves show this chart of banking reserves:
 Source: Federal Reserve
As an aside, this article entitled 'When is rapid growth in a central bank's balance sheet not cause for concern?' makes an interesting point about bank reserve developments in New Zealand. In July 2006, the Reserve Bank of New Zealand (RBNZ) changed the monetary policy operating system from a channel or corridor system to a floor system. "Under this floor system, the RBNZ stopped offering free collateralized daylight credit to banks for settlement purposes. In other words, they removed the distinction between daylight and overnight reserves. Also under this new system, reserves were remunerated at the official cash rate (OCR), the RBNZ's target interest rate." The new level of bank reserves increased by about 400times and moved to roughly NZD 8 billion (which corresponds to almost 25% of GDP). However, M1 was unmoved by this.
As the US Fed has started to pay for excess reserves, it should be expected that at least part of the rise in bank reserves is permanent and even once the ability of banks to extend credit is normalised and the demand for credit by corporates and households is rising as well, not all reserves will be used up.
So, in short broad based credit aggregates are falling by more than narrow-based monetary aggregates are rising. However, once broad-based credit aggregates are rising again (which can take a long time as it needs both, banks which are willing to lend and households/corporates which are willing to borrow), we should also expect narrow-based monetary aggregates to fall again. The ultimate inflationary pressure will be very limited and take a long time before it becomes evident.
For the time being, we still have too little money chasing too many goods resulting in disinflation or as in the case of Ireland in significantly negative inflation (or does anyone dare to say: deflation?):

Thursday, July 9, 2009
Random Thoughts July 9
a) The ECB has published a document called 'The international role of the Euro'. One article focuses on the private use of the euro as a parallel currency in non-Eurozone countries. It finds that during 2008 especially in Central Eastern Europe as well as in Southern Europe holdings of Euro banknotes increased. "Evidence from a number of sources suggest that euro banknotes are increasingly used in countries east of the EU, mainly as a store of value and for large transactions." Furthermore: "Around EUR95 billion worth of euro banknotes were estimated to be in circulation outside the euro area at the end of Deccember 2008, around 13% of the euro banknotes in circulation for that reference month." This is up from 71.1 billion at the end of 2007.
To me one sign of a potential upcoming currency crisis is that domestics lose faith in their own currency and divert their assets into another currency while starting to use foreign currency for daily transactions. This leads to a lower demand for the home currency with likely inflationary consequences. On the other side, it increases demand for the foreign currency (in this case the Euro) which might well add to already existing disinflationary consequences.
b) Risky assets have moved signficantly lower since the start of the month and the larger equity indices have lost approx. 10% from their late May highs. However, commodities - especially energy - has been hit even harder. The chart below shows the CRB-Index since the start of the year. Between late February and mid June, the CRB gained 33% but is now up only 15.5% (so it lost half its previous gains). Equities on the other side, have gained more during their spring rally and lost less so far in the current correction.
 To me this confirms that the end demand for commodities is weak (as it should be given the world-wide recession) and that a lot of the run-up in prices has been down to stockpiling and speuclation. However, especially stockpiling can not go on forever as it is costly to hold physical commodities and the capacity to do so are limited. Furthermore, the recent sell-off in broader commodity indices confirms also that inflation is not around the corner and a 'flight' into real assets amid inflation and sovereign default worries carries substantial risks as well. However, this should not be so surprising given that we have a destruction of real demand and an oversupply in several real assets (most notably housing): Too little money chasing too many goods!
Wednesday, July 8, 2009
Rates Strategy Update: Digging below the surface
Over the past month, UST and Bund yields have fallen significantly. I maintain my strategic long duration outlook amid expectations for only a muted and temporary recovery as well as the absence of any meaningful inflation pressures. However, there are several noteworthy developments which lead me to conclude that German Bunds appear a bit expensive from an RV perspective and are likely to consolidate before taking another leg higher:
The drop in 10y UST and Bund yields since June 10 was of similar magnitude (51bp vs. 42bp). However, in the
Why this diverging behaviour? I guess that the outperformance of US Swaps is largely down to an unwinding of convexity hedging performed in swaps during the previous sell-off (remember: convexity hedging amplifies swings in yields as it leads to swap receiving during a bull-market and swaps paying during a bear-market). The chart below compares the development of 10y US and 10y Eurozone swap spreads. During the risk-recovery period since mid March, swapspreads tightend in the
 Source: Bloomberg
Where to go from here? I remain bearish on inflation-linked products on a medium-term basis. However, amid the significant difference between break-evens priced into inflation-linked bonds and the level of inflation swaps, it is much more the latter which should drop and here especially EUR inflation-linked swaps appear too high. I do not see how inflation pressure can be rising if risk aversion is rising, commodities are falling and the green shoots are turning yellow which puts a dampener on recovery hopes.
UST and Bund yields can drop further over the medium term. Positioning in the
So, strategically I remain bullish on UST and Bunds but from a tactical perspective I move to a neutral stance and look for an underperformance of Bunds.
 Source: tradesignalonline.com
Tuesday, July 7, 2009
The UK: Down and out?
UK's green shoots have arguably been a bit greener than elsewhere. For example Halifax house prices rose by 2.6% in May with also the Nationwide survey indicating rising house prcies, the services PMI rose back above 50 in June and stayed there this month and also unemployment is rising less fast than expected. All this is clearly encouraging for the short term. However, I remain seriously worried about the more longer-term outlook and consider the risks for an inflationary outcome amid a significantly weaker currency and rising sovereign default concerns as being the most pronounced by far of any of the larger non-EM economies (just as a reminder: I expect US and EUR nominal growth to be very low for a multi-year period amid low real growth and low inflation).
I think the key reason for the positive UK data surprises are the larger macro-economic stimulus than for example in Europe. First, the BoE was faster in cutting rates than the ECB and also engaged in a more aggressive asset purchasing program sooner. Additionally, the fiscal stimulus in the UK is significant. Finally, the drop in GBP on a trade-weighted-basis has provided an additional boost. GBP dropped by almost 30% between August 2007 and January 2009 (see chart). On the other side, the trade-weighted Euro gained some 3% during the same time period.
 Source: Bloomberg
Such a huge drop of 30% provides an additional boost, be it in the form of import substitution (as imported goods and services become much more expensive) and gains in export market shares. Additionally, UK assets have become 30% cheaper for non-residents just due to the exchange rate. For example UK houses have become cheaper by approx. 50% for non-residents (approx. 30% drop in GBP + approx. 20% drop in house prices), an enourmous drop.
So, I think that the recent UK developments are down to a more significant and more timely stimulus (as the exchange rate started to fall already in 2007) than elsewhere but not down to a better underlying economic situation. Rather to the contrary, the structural problems the UK economy is facing are even more substantial than elsewhere. For one, the structural imbalances (overvalued housing market, over-indebted under-saving consumer, high current account deficit to name a few) are at least as pronounced as in the US. However, the banking sector liabilities are significantly larger and the share of the financial sector is larger than in the US (with the added threat of tighter regulation of the financial sector pushing financial institutions out of the UK). Furthermore, the sustained current account deficit of the past years led to foreign investors pouring capital into the UK. While this seemed attractive when the UK was perceived as a high-growth, high-return economy, the prospects for ZIRP by the BoE and extended real growth weakness are changing the investment rationale. In contrast to the situation in the US, so far the UK current account deficit has failed to really improve and deteriorated even further in Q4 with only a small improvement in Q1 at higher than expected levels. Additionally, while inflation has come down significantly in the US, the Eurozone and the UK, the fall in UK CPI was much less pronounced (see chart for developments of YOY CPI).
 Source: Bloomberg
Finally, the fall in UK inflation was also much less than expected. The chart below adds the difference between actual inflation (mom value) minus the forecasted value (Bloomberg consensus). While during 2007, US inflation tended to overshoot vs. expectations, since mid 2008 this has been the reverse. In the Eurozone (I have used German inflation as it is been released relatively early), inflation tended to be more or less in line with expectations. In the UK, however, since early 2008, the consensus has consistently underestimated inflation (be it on the way up during early 2008 as well as on the way down over the past months).
 Source: Bloomberg
Overall, I do not see how the UK can get back on a sustainable growth path already and think that the positive economic surprises are purely down to a more pronounced macro-economic stimulus and will prove temporary. Rather, the structural problems are very pronounced and will take a long time to be reduced with trend growth falling significantly in turn. In combination with the huge fiscal and current account deficits, the risk remains that foreign investors will take money out of the UK again. Whereas there is no alternative to the USD (yet), international investors do not really need to hold GBP.
I think that the recovery in GBP of the past months' has run its course and we are in for another longer-lasting move lower. EURGBP is likely to retest its highs above 0.95 in this process. While I think it is too early to short Gilts as Gilt yields should be able to drop further over the next weeks/months as they are pulled lower by their US and Eurozone counterparts, I recommend a more cautious positioning with only a very limited exposure.
I think the key reason for the positive UK data surprises are the larger macro-economic stimulus than for example in Europe. First, the BoE was faster in cutting rates than the ECB and also engaged in a more aggressive asset purchasing program sooner. Additionally, the fiscal stimulus in the UK is significant. Finally, the drop in GBP on a trade-weighted-basis has provided an additional boost. GBP dropped by almost 30% between August 2007 and January 2009 (see chart). On the other side, the trade-weighted Euro gained some 3% during the same time period.
 Source: Bloomberg
So, I think that the recent UK developments are down to a more significant and more timely stimulus (as the exchange rate started to fall already in 2007) than elsewhere but not down to a better underlying economic situation. Rather to the contrary, the structural problems the UK economy is facing are even more substantial than elsewhere. For one, the structural imbalances (overvalued housing market, over-indebted under-saving consumer, high current account deficit to name a few) are at least as pronounced as in the US. However, the banking sector liabilities are significantly larger and the share of the financial sector is larger than in the US (with the added threat of tighter regulation of the financial sector pushing financial institutions out of the UK). Furthermore, the sustained current account deficit of the past years led to foreign investors pouring capital into the UK. While this seemed attractive when the UK was perceived as a high-growth, high-return economy, the prospects for ZIRP by the BoE and extended real growth weakness are changing the investment rationale. In contrast to the situation in the US, so far the UK current account deficit has failed to really improve and deteriorated even further in Q4 with only a small improvement in Q1 at higher than expected levels. Additionally, while inflation has come down significantly in the US, the Eurozone and the UK, the fall in UK CPI was much less pronounced (see chart for developments of YOY CPI).
 Source: Bloomberg
Finally, the fall in UK inflation was also much less than expected. The chart below adds the difference between actual inflation (mom value) minus the forecasted value (Bloomberg consensus). While during 2007, US inflation tended to overshoot vs. expectations, since mid 2008 this has been the reverse. In the Eurozone (I have used German inflation as it is been released relatively early), inflation tended to be more or less in line with expectations. In the UK, however, since early 2008, the consensus has consistently underestimated inflation (be it on the way up during early 2008 as well as on the way down over the past months).
 Source: Bloomberg
Overall, I do not see how the UK can get back on a sustainable growth path already and think that the positive economic surprises are purely down to a more pronounced macro-economic stimulus and will prove temporary. Rather, the structural problems are very pronounced and will take a long time to be reduced with trend growth falling significantly in turn. In combination with the huge fiscal and current account deficits, the risk remains that foreign investors will take money out of the UK again. Whereas there is no alternative to the USD (yet), international investors do not really need to hold GBP.
I think that the recovery in GBP of the past months' has run its course and we are in for another longer-lasting move lower. EURGBP is likely to retest its highs above 0.95 in this process. While I think it is too early to short Gilts as Gilt yields should be able to drop further over the next weeks/months as they are pulled lower by their US and Eurozone counterparts, I recommend a more cautious positioning with only a very limited exposure.
Monday, July 6, 2009
Gold: still more downside ahead
Gold is frequently being sold as outperforming during both, inflationary as well as deflationary periods. So irrespective of where we are headed, gold will be doing well. Additionally, it is being stated that while gold has maintained its purchasing power in real terms over long periods of time, paper money has not. The USD for example has lost approx. 95% of its purchasing power over the last 100years. I am not denying any of these statements. However, I think that this is not all there is and I remain unconvinced in the gold story.
1) Inflation targetting central banks nowadays have an explicit or implicit inflation target which is usually close to 2%. At 2%, money loses 50% of its purchasing power every 35 years. This is planned and generally accepted (furthermore, it is also known). More importantly, it is also incorporated into prices (most notably inflation expectations and therefore yields).
2) Additionally, I am not forced to hold my money in cash, in fact, most people hold only a very small part of their wealth in cash and invest most of their wealth in one form or another. On these investments you earn a yield. Even with short-dated US government bonds you have earned a substantial positive return over the past 100 years. On the other side, gold as an investment does not pay any coupon or dividends, the change in the price of gold is already your total return. Therefore, if people compare the change in the price of gold (a total return) with the change in the purchasing power of cash (without compounding via the help of a short-term interest rate), then the comparison is not done on equal grounds. This is especially relevant if done for longer horizons.
3) The volatility in the price of gold is very substantial: Gold reached a high in the early 1980s and it took approx. 25 years before this price was reached again in nominal terms. However, in real terms, the current price is still far off the levels reached almost 30 years ago.
4) End demand for gold is falling. Gold is also used as a durable consumer good (in the form of jewelry) and is used in medicine/electronics. However, amid the drop in GDP growth across the globe, demand for such usages are falling.
I personally think that across the large majority of countries in the so-called 'developed' economies, a scenario of currency crisis/sovereign default can be averted. Furthermore, as stated frequently, I am not a believer that high inflation rates are around the corner. Rather nominal GDP growth will be low for a multi-year period. Low nominal growth without wars/currency debasements is exactly NOT the environment where gold is likely to do well. Having a small share of ones wealth invested in Gold as an insurance makes sense from an asset allocation perspective, however, I continue to see more performance potential for government and high grade corporate bonds in the major currencies than for gold (be it in USD or EUR). As inflation fears are currently easing, I expect gold to fall further over the summer.
Friday, July 3, 2009
Trend growth can not defy gravity
Trend growth promises to drop in the years ahead. For one, the credit-financed housing and consumption boom of the past years has increased trend growth during that time period. This, however, is unlikely to be repeated and in turn trend growth should fall as credit creation eases (or even reverts). In fact, this is what happened in Japan during the 1990s and in Germany once the re-unification-led construction boom faded. However, the lack of credit creation is not the only thing which will limit trend growth. The credit-financed construction and consumption boom has rendered several industrial sectors too large (for example: finance or any housing related activities such as construction but also real estate agents). These sectors are likely to shrink on a trend basis vs. the rest of the economy. In turn, a lot of capital which has been used in these industries (be it physical capital or human capital) becomes unproductive. It takes time to redeploy the physical capital (if possible) or for employees to retrain in order to secure a job in another industry (if there are any available on cyclical grounds). Therefore, during this period structural unemployment/NAIRU (non accelerating inflation rate of unemployment) raises and trend growth will be reduced as well. Finally, the lack of demand in general will lead companies to lower their investment and therefore the capital deployed in an economy will be growing at a lower rate than before.
In turn, trend growth across a number of economies (most significantly in those countries exhibiting large imbalances, high indebtdedness, having 'enjoyed' the most pronounced housing boom) such as the US, the UK, large parts of the Eurozone, CEE etc. will fall significantly. It is very difficult to quantify by how much trend growth will be falling but the severity of the imbalances suggest it might be very substantial and prolonged.
Still, the Directorate-General for Economic and Financial Affairs of the European Commission in its latest quarterly report on the Euro area tries to quantify a likely trajectory of trend growth (see here, page 27ff.). They estimate Eurozone potential growth to have been at 1.8% during 2000-2006 but falling to 1.6% in 2007, 1.3% in 2008, 0.7% in 2009 and 2010. in turn, NAIRU will increase from 8.5% to 10.2%!
Personally, I find it very spurious to calculate a yearly trend growth rate but the drop of roughly 1% in trend growth sounds about right. This would clearly not be good for the development of real assets and is hardly in the price already.
Thursday, July 2, 2009
Market Update: Consolidation or Correction?
While risky asset markets are rather in a consolidation than correction mode, government bond yields have dropped markedly. Looking ahead, I maintain the government bond-bullish outlook which I adopted early June (see here: Have we seen the highs in UST and Bund yields?) as well as my defensive asset allocation (Asset allocation: defensive stance).
The underlying economic situation is improving only slowly and the output gap is increasing further, leading to an ongoing easing in inflationary pressures. Today's employment report confirmed this. While unemployment tends to lag the recovery, there are some forward looking elements within the report, such as temporary work and hours worked. Temporary workers are usually the first to be let go and the first to be hired. However, the number of temporary workers is still declining (-38k vs. May09) while average weekly hours declined slightly. I also look at what I call the index of aggregate weekly earnings. This is constructed by multiplying average weekly earnings with the index of aggregate weekly hours for the private sector (for more details see here: Consumer deleveraging spiral still getting worse). The chart shows the yoy change in this index. The sum of wages paid to private sector workers is declining at an unprecedented rate of 4.4% (after 3.8% in May) amid easing wage growth and sharply dropping aggregate hours worked.
 Combined with the destruction in households' net worth, this is a strongly disinflationary development. Employment benefits and active fiscal easing by the federal government cushion the negative impact on households' income. However, the fiscal easing would need to increase further given the ongoing drop in income. Therefore, the outlook for consumption remains very bleak!
In the Eurozone, the situation remains even more fragile amid a less aggressive ECB than its US counterpart but a more substantial drop in growth across a host of Eurozone countries. Today's acknowledgement by the ECB that there might be more rate cuts if necessary is at least a positive sign and accepting the reality of falling inflation (and therefore potentially higher real yields) and further falls in domestic and external demand.
Overall, the outlook for nominal growth remains very subdued amid low/negative real growth and lower inflation. This will seriously constrain the ability of real assets to show positive returns! The risk remains that the current consolidation in commodities and equity markets (<=10% price fall) turns into a correction (>10% fall in prices). Government bonds on the other side should remain underpinned. Stay defensive in equities/commodities but stick to long duration positions in Bunds and USTs.
Random Thoughts 02 July 2009
Random Thoughts is a regular column with the aim of providing some interesting bits and pieces but does not give a holistic picture/view/outlook.
a) Restrictive fiscal policy: the budget woes in California highlight that fiscal policy is not universally accommodative in the US. For a short overview of Furlough Fridays back - now three days a month. Amongst others, "The executive order signed by Schwarzenegger will reinstate 'Furlough Fridays', requiring more than 200,000 state workers to take unpaid leaves on the first three Fridays of each month. The move amounts to an additional 4.62 percent pay cut for state workers, bringing their total reduction in 2009 to about 14 percent because of two furlough days imposed previously. " Clearly that is a disinflationary development. The problem is not confined to California. In fact a lot of US states have to cut spending/increase taxes and thereby run a pro-cyclical fiscal policy. Discussion about further necessary support for the states by the federal government is ongoing and is likely to intesify. What is more, problems are not confined to states only as also cities face severe budgetary issues, see for example here: El Monte avoids bankruptcy after police union agrees to cuts.
b) US Monetary policy: two interesting articles by inflation doves. San Francisco Fed president Yellen remains more worried about a sluggish recovery and easing inflation pressures (see here). More interesting is one comment about future Fed tightening: 'the Fed can push up the federal funds rate by raising the rate of interest that we pay to banks on the reserve balances they have on deposit with us—authority that was granted to us by Congress last year. An increase in the interest rate on reserves will induce banks to lend money to us rather than to other banks and borrowers, thereby pushing up the federal funds rate and other rates charged to private borrowers throughout the economy. The ability to pay interest on reserves is an important tool because, as I mentioned, it’s conceivable that, even if the economy rebounds nicely, the credit crunch might not be fully behind us and some financial markets might still need Fed support. This tool will enable us to tighten credit conditions even though our balance sheet wouldn’t shrink.'
This is interesting in the sense that it generally is seen that the Fed would first shrink its balance sheet and then hike rates. But clearly they have the option to go down a different route.
Alan Blinder - a former vice chairman of the Federal Reserve - states in Why inflation isnt the danger that banks hold excess reserves and therefore Fed's balance sheet lengthening is not inflationary. I fully agree with this. With respect to future tightening, Blinder makes one interesting point: 'The possibilities for error are two-sided. Yes, the Fed might err by withdrawing bank reserves too slowly, thereby leading to higher inflation. But it also might err by withdrawing reserves too quickly, thereby stunting the recovery and leading to deflation. I fail to see why advocates of price stability should worry about one sort of error but not the other.'
c) Too much hope in the Chinese growth saves the world story? There is a lot of talk about the strength of the Chinese economy. A shift away from the export driven GDP growth model towards a more consumption-driven model of growth would be welcome. This would add to global demand and at the same time would help to reduce global imbalances (via a reduction in the Chinese current account surplus). China has the means to promote growth via macro-economic stimulus and is doing so. Despite being the world's manufacturing powerhouse, the economy seems to be back on a good growth path (However, it remains questionable whether China can divert itself towards a sustainable growth path without relying on export growth). Still, while it certainly helps, I fail to see how that alone will take the global economy out of the dolldrums in the short term as nominal GDP is just not high enough compared to the ailing advanced economies (see chart, source: IMF). The nominal GDP of the US economy alone accounts for some 25% of world nominal GDP with Japan 9% and the Euro Area 21%. With the outlook being that Japan continues its weakish growth, Eurozone trend growth to be a bit weaker than since its inception (amid the substantial structural imbalances in the so-called periphery and Spain) while the US should see trend GDP growth significantly lower than during the last years, we will have 55% of current nominal world GDP failing to deliver a significant increase in demand. China itself accounts for 9% of world nominal GDP (so it is currently the size of Japan according to the IMF). This size of 9% is just not high enough to overcome the weakness in 55% of the world economy.

Subscribe to:
Posts (Atom)


